
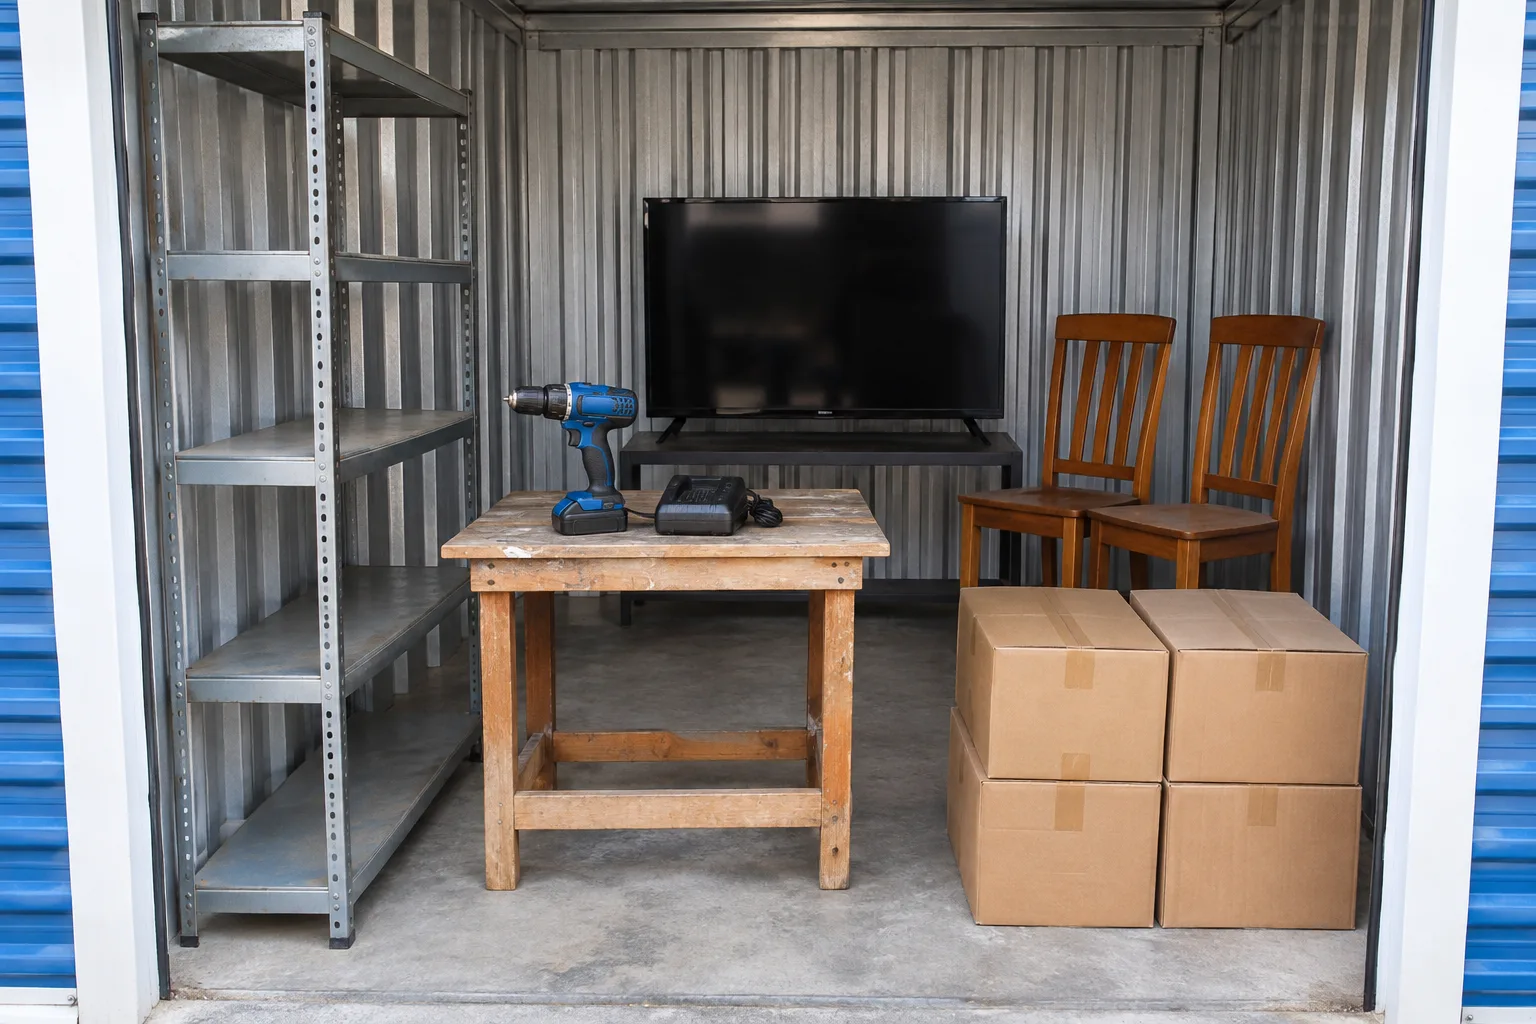
Visible inventory and illustrative ranges
The range is deliberately separate from a claimed selling result. The photo cannot establish model numbers or function. The demonstration assigns no proceeds to hidden contents. Selling expenses would need to be deducted from any eventual gross receipts.
| Visible group | Assumed range | What still needs checking |
|---|---|---|
| Metal shelving | $30–$70 | Rust, stability and ability to disassemble |
| Drill and charger | $20–$60 | Model, working battery and charger compatibility |
| Wood workbench | $30–$80 | Joint strength, dimensions and pickup demand |
| Two dining chairs | $20–$60 | Loose joints, damage and whether the pair matches |
| Flat-screen TV | $0–$80 | Model, working screen, inputs and included stand |
| Four closed boxes | $0 assumed | Contents are unknown and excluded from proceeds |
| Total visible-goods estimate | $100–$350 | Planning range only; not a market appraisal |
Risk flags worth acting on
- The TV has not been powered on. Its low-end proceeds are zero.
- The drill’s battery health and exact model are unverified.
- Furniture and shelving can be bulky relative to their selling value.
- Closed boxes create cleanout and disposal uncertainty.
- There is one synthetic view, so hidden damage and blind spots remain unresolved.
A transparent bid calculation
For this teaching scenario, choose $250 in expected proceeds after selling expenses, $100 for transport, disposal and labor, a $50 reserve and $50 required profit. Assume an effective 20% auction fee-and-tax rate for the math only.
That leaves $50 before auction overhead. $50 ÷ 1.20 = a $41.66 maximum hammer bid, rounded down. At a hypothetical current bid of $50, the next bid would already exceed this example’s ceiling.
| Input | Example amount |
|---|---|
| Expected net resale proceeds | $250 |
| Fixed costs | −$100 |
| Risk reserve | −$50 |
| Required profit | −$50 |
| Available before auction overhead | $50 |
| Illustrative overhead rate | 20% |
| Maximum hammer bid | $41.66 |
| Hypothetical current bid | $50 |
| Decision under these assumptions | Pass |
If proceeds fall to $150, the same costs, reserve and profit leave no room for a bid. Neither $250 nor the 20% rate is a forecast or a platform quotation. Use the actual listing’s charges.
What to check in your own LockerLens report
Compare the named items with every listing photo. Check any supplied sold-comparison links, investigate the most valuable assumptions, then substitute your own pickup and selling costs. A high score does not remove the need for that review.
A useful report can lead you to pass. Keep the estimate and, if you buy the unit, record actual purchase costs and eventual net proceeds separately. That evidence is needed before any estimate-versus-outcome case study can be published.